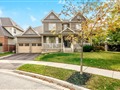
177 Farrington Crossing
$1,602,442
Comparative Market Analysis
May 3, 2024
NOT AN ACTIVE LISTING
Historical Performance
| Period | $ Change | % Change |
| 1 Day | +$442 | +0.028% |
| 7 Days | +$208 | +0.013% |
| 30 Days | -$3,137 | -0.195% |
| 3 Months | -$5,529 | -0.344% |
| 6 Months | +$24.7k | +1.57% |
| 1 Year | -$78.4k | -4.66% |
| 3 Years | +$293k | +22.3% |
| 5 Years | +$500k | +45.4% |
| 10 Years | +$928k | +138% |
List My Property
Real Estate Statistics
Financing Solutions
AS SEEN ON


Are You a Licensed Real Estate Agent or Broker?