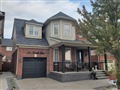
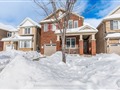
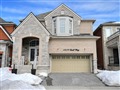
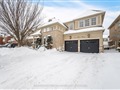
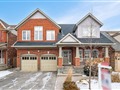
202 Fennamore Terr
$1,432,755
Comparative Market Analysis
Jun 28, 2025
NOT AN ACTIVE LISTING
Historical Performance
| Period | $ Change | % Change |
| 1 Day | +$405 | +0.028% |
| 7 Days | +$259 | +0.018% |
| 30 Days | -$2,536 | -0.177% |
| 3 Months | -$4,170 | -0.290% |
| 6 Months | +$23.7k | +1.69% |
| 1 Year | -$65.3k | -4.36% |
| 3 Years | +$279k | +24.2% |
| 5 Years | +$449k | +45.6% |
| 10 Years | +$816k | +132% |
List My Property
Real Estate Statistics
Financing Solutions
Browsing History
42 Gleave Terr, Milton
1 second ago
244 Gleave Terr, Milton
1 second ago
AS SEEN ON


Are You a Licensed Real Estate Agent or Broker?