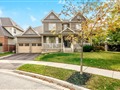
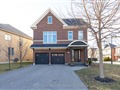
263 Holloway Terr
$1,323,347
Comparative Market Analysis
May 3, 2024
NOT AN ACTIVE LISTING
Historical Performance
| Period | $ Change | % Change |
| 1 Day | +$365 | +0.028% |
| 7 Days | +$160 | +0.012% |
| 30 Days | -$2,649 | -0.200% |
| 3 Months | -$4,737 | -0.357% |
| 6 Months | +$20.1k | +1.54% |
| 1 Year | -$65.2k | -4.70% |
| 3 Years | +$242k | +22.4% |
| 5 Years | +$413k | +45.4% |
| 10 Years | +$750k | +131% |
List My Property
Real Estate Statistics
Financing Solutions
AS SEEN ON


Are You a Licensed Real Estate Agent or Broker?