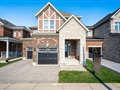
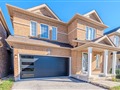
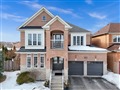
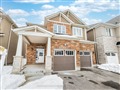
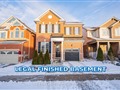
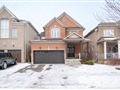
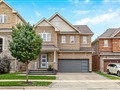
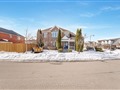
320 Mcgibbon Dr
$1,519,562
Comparative Market Analysis
Jul 9, 2025
NOT AN ACTIVE LISTING
Historical Performance
| Period | $ Change | % Change |
| 1 Day | +$441 | +0.029% |
| 7 Days | +$192 | +0.013% |
| 30 Days | -$3,214 | -0.211% |
| 3 Months | -$6,374 | -0.418% |
| 6 Months | +$20.8k | +1.39% |
| 1 Year | -$79.9k | -4.99% |
| 3 Years | +$239k | +18.7% |
| 5 Years | +$359k | +31.0% |
| 10 Years | +$713k | +88.4% |
List My Property
Real Estate Statistics
Financing Solutions
AS SEEN ON

Are You a Licensed Real Estate Agent or Broker?