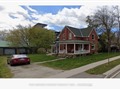
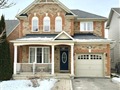
374 Inman Hts
$1,208,653
Comparative Market Analysis
Jun 2, 2025
NOT AN ACTIVE LISTING
Historical Performance
| Period | $ Change | % Change |
| 1 Day | +$333 | +0.028% |
| 7 Days | +$336 | +0.028% |
| 30 Days | -$1,474 | -0.122% |
| 3 Months | -$1,153 | -0.095% |
| 6 Months | +$25.3k | +2.13% |
| 1 Year | -$42.3k | -3.38% |
| 3 Years | +$282k | +30.4% |
| 5 Years | +$461k | +61.6% |
| 10 Years | +$709k | +142% |
List My Property
Real Estate Statistics
Financing Solutions
Browsing History
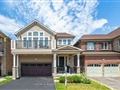
127 Swindale Dr, Milton
2 seconds ago
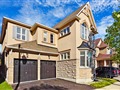
351 Inman Hts, Milton
2 seconds ago
AS SEEN ON


Are You a Licensed Real Estate Agent or Broker?