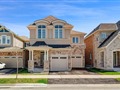
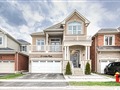
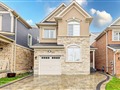
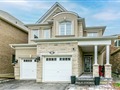
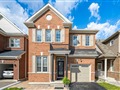
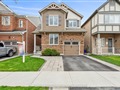
438 Grey Landing
$1,523,548
Comparative Market Analysis
May 5, 2024
NOT AN ACTIVE LISTING
Historical Performance
| Period | $ Change | % Change |
| 1 Day | +$425 | +0.028% |
| 7 Days | +$964 | +0.063% |
| 30 Days | +$821 | +0.054% |
| 3 Months | +$7,855 | +0.518% |
| 6 Months | +$53.1k | +3.61% |
| 1 Year | +$4,186 | +0.275% |
| 3 Years | +$535k | +54.1% |
| 5 Years | +$701k | +85.2% |
| 10 Years | +$1.00m | +193% |
List My Property
Real Estate Statistics
Financing Solutions
AS SEEN ON


Are You a Licensed Real Estate Agent or Broker?