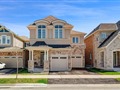
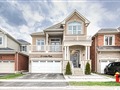
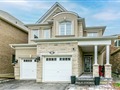
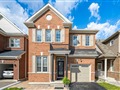
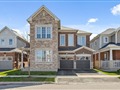
439 Grey Landing
$1,498,093
Comparative Market Analysis
May 6, 2024
NOT AN ACTIVE LISTING
Historical Performance
| Period | $ Change | % Change |
| 1 Day | +$418 | +0.028% |
| 7 Days | +$134 | +0.009% |
| 30 Days | -$3,277 | -0.218% |
| 3 Months | -$6,359 | -0.423% |
| 6 Months | +$20.6k | +1.39% |
| 1 Year | -$78.9k | -5.00% |
| 3 Years | +$270k | +22.0% |
| 5 Years | +$448k | +42.7% |
| 10 Years | +$834k | +126% |
List My Property
Real Estate Statistics
Financing Solutions
AS SEEN ON


Are You a Licensed Real Estate Agent or Broker?