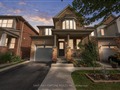
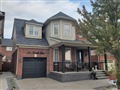
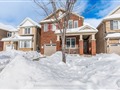
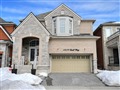
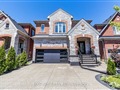
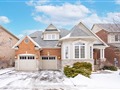
656 Rayner Crt
$1,169,756
Comparative Market Analysis
Jun 28, 2025
NOT AN ACTIVE LISTING
Historical Performance
| Period | $ Change | % Change |
| 1 Day | +$331 | +0.028% |
| 7 Days | +$183 | +0.016% |
| 30 Days | -$2,212 | -0.189% |
| 3 Months | -$3,902 | -0.332% |
| 6 Months | +$18.2k | +1.58% |
| 1 Year | -$56.4k | -4.60% |
| 3 Years | +$216k | +22.7% |
| 5 Years | +$354k | +43.4% |
| 10 Years | +$661k | +130% |
List My Property
Real Estate Statistics
Financing Solutions
Browsing History
742 Syer Dr, Milton
6 seconds ago
1204 Mowat Lane, Milton
11 seconds ago
737 Thompson S Rd, Milton
16 seconds ago
320 Highside Dr, Milton
21 seconds ago
701 Syer Dr, Milton
26 seconds ago
688 Edwards Ave, Milton
31 seconds ago
AS SEEN ON


Are You a Licensed Real Estate Agent or Broker?