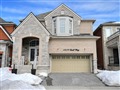
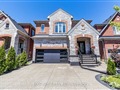
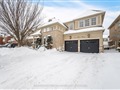
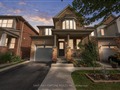
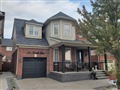
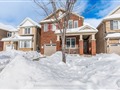
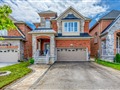
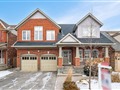
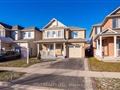
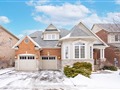
672 Rayner Crt
$1,148,684
Comparative Market Analysis
Jun 28, 2025
NOT AN ACTIVE LISTING
Historical Performance
| Period | $ Change | % Change |
| 1 Day | +$325 | +0.028% |
| 7 Days | +$140 | +0.012% |
| 30 Days | -$2,369 | -0.206% |
| 3 Months | -$4,467 | -0.387% |
| 6 Months | +$16.6k | +1.47% |
| 1 Year | -$58.4k | -4.84% |
| 3 Years | +$203k | +21.5% |
| 5 Years | +$329k | +40.2% |
| 10 Years | +$617k | +116% |
List My Property
Real Estate Statistics
Financing Solutions
Browsing History
1284 Ellenton Cres, Milton
1 second ago
885 Challinor Terr, Milton
1 second ago
424 Gowland Cres, Milton
2 seconds ago
AS SEEN ON


Are You a Licensed Real Estate Agent or Broker?