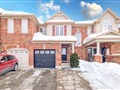
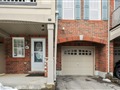
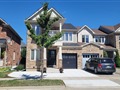
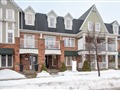
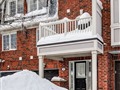
703 Rayner Crt
$954,483
Comparative Market Analysis
Jun 28, 2025
NOT AN ACTIVE LISTING
Historical Performance
| Period | $ Change | % Change |
| 1 Day | +$485 | +0.051% |
| 7 Days | +$1,125 | +0.118% |
| 30 Days | -$1,138 | -0.119% |
| 3 Months | -$3,633 | -0.379% |
| 6 Months | +$14.1k | +1.50% |
| 1 Year | -$43.0k | -4.31% |
| 3 Years | +$172k | +22.0% |
| 5 Years | +$290k | +43.6% |
| 10 Years | +$558k | +141% |
List My Property
Real Estate Statistics
Financing Solutions
Browsing History
822 Syer Dr, Milton
5 seconds ago
784 Rayner Crt, Milton
10 seconds ago
794 Syer Dr, Milton
15 seconds ago
423 Cedric Terr, Milton
20 seconds ago
948 Philbrook Dr, Milton
25 seconds ago
611 Gervais Terr, Milton
30 seconds ago
747 Edwards Ave, Milton
35 seconds ago
216 Laurier Ave, Milton
40 seconds ago
787 Agnew Cres, Milton
44 seconds ago
AS SEEN ON

Are You a Licensed Real Estate Agent or Broker?