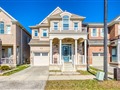
763 Shanks Hts
$1,749,516
Comparative Market Analysis
Apr 25, 2024
NOT AN ACTIVE LISTING
Historical Performance
| Period | $ Change | % Change |
| 1 Day | +$496 | +0.028% |
| 7 Days | +$1,115 | +0.064% |
| 30 Days | +$884 | +0.051% |
| 3 Months | +$8,464 | +0.486% |
| 6 Months | +$59.0k | +3.49% |
| 1 Year | -$2,316 | -0.132% |
| 3 Years | +$599k | +52.0% |
| 5 Years | +$810k | +86.1% |
| 10 Years | +$1.11m | +175% |
List My Property
Real Estate Statistics
Financing Solutions
AS SEEN ON


Are You a Licensed Real Estate Agent or Broker?