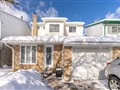
803 Cabot Tr
$980,277
Comparative Market Analysis
Jun 27, 2025
NOT AN ACTIVE LISTING
Historical Performance
| Period | $ Change | % Change |
| 1 Day | +$293 | +0.030% |
| 7 Days | +$176 | +0.018% |
| 30 Days | -$1,897 | -0.193% |
| 3 Months | -$3,672 | -0.373% |
| 6 Months | +$14.2k | +1.47% |
| 1 Year | -$49.4k | -4.80% |
| 3 Years | +$164k | +20.0% |
| 5 Years | +$288k | +41.6% |
| 10 Years | +$564k | +135% |
List My Property
Real Estate Statistics
Financing Solutions
Browsing History
695 Peacock Lane, Milton
2 seconds ago
8741 Tremaine Rd, Milton
3 seconds ago
430 Woodlawn Cres, Milton
4 seconds ago
679 Holly Ave, Milton
5 seconds ago
803 Gazley Circ, Milton
6 seconds ago
916 Childs Dr, Milton
7 seconds ago
935 Sprague Pl, Milton
8 seconds ago
306 Woodlawn Cres, Milton
9 seconds ago
214 Harvest Dr, Milton
10 seconds ago
920 Gazley Circ, Milton
11 seconds ago
AS SEEN ON


Are You a Licensed Real Estate Agent or Broker?