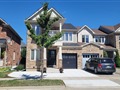
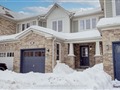
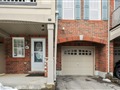
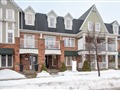
813 Fowles Crt
$1,116,538
Comparative Market Analysis
Jun 28, 2025
NOT AN ACTIVE LISTING
Historical Performance
| Period | $ Change | % Change |
| 1 Day | +$568 | +0.051% |
| 7 Days | +$4,261 | +0.383% |
| 30 Days | +$14.6k | +1.33% |
| 3 Months | +$60.9k | +5.77% |
| 6 Months | +$184k | +19.8% |
| 1 Year | +$330k | +42.0% |
| 3 Years | +$459k | +69.8% |
| 5 Years | +$543k | +94.6% |
| 10 Years | +$740k | +196% |
List My Property
Real Estate Statistics
Financing Solutions
AS SEEN ON


Are You a Licensed Real Estate Agent or Broker?