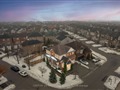
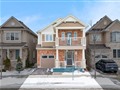
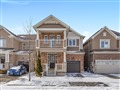
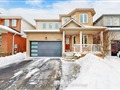
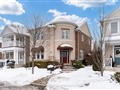
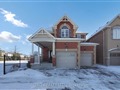
913 Mcewan Dr
$1,472,812
Comparative Market Analysis
Jun 28, 2025
NOT AN ACTIVE LISTING
Historical Performance
| Period | $ Change | % Change |
| 1 Day | +$417 | +0.028% |
| 7 Days | +$152 | +0.010% |
| 30 Days | -$3,181 | -0.216% |
| 3 Months | -$6,223 | -0.421% |
| 6 Months | +$20.2k | +1.39% |
| 1 Year | -$77.5k | -5.00% |
| 3 Years | +$261k | +21.6% |
| 5 Years | +$455k | +44.7% |
| 10 Years | +$901k | +158% |
List My Property
Real Estate Statistics
Financing Solutions
AS SEEN ON

Are You a Licensed Real Estate Agent or Broker?